August 11, 2021
This post was originally published on the Sage Intacct Blog
Financial reporting is a key work product of the nonprofit accounting team. Reporting delivers value in the areas of compliance, analysis, planning and strategy, and organizational transparency. Accurate, easy-to-understand reports and dashboards help instill confidence when you’re communicating with the Board and donors/funders.
Recently, two of Sage Intacct’s top nonprofit financial reporting experts, Katie McCloskey and MaryFrances Pidgeon, presented Tips & Tricks for Sharing Financial Data at the virtual Nonprofit Finance Leaders Forum.
 Katie McCloskey is a CPA with over twenty years of experience helping a wide variety of nonprofit and healthcare organizations to achieve their compliance, transparency and insights goals by leveraging best practices in the use of finance systems. She’s spent decades helping organizations deliver better nonprofit financial information by training accounting teams, consulting with leaders, and designing reports, dashboards, and visualizations.
 MaryFrances Pidgeon has 25+ years of accounting experience with a diverse background that’s included tax/corporate accounting positions at Ernst & Young and Time Inc. and Controller for public and private corporations. Later, she joined ERP software vendor JD Edwards and now serves at Sage Intacct, where she helps the product marketing and development teams understand governmental compliance requirements of nonprofit organizations, as well as the operational reporting and functional aspects required by Internal Staff, Executives, Board of Directors, Stakeholders and Trustees.
Watch a replay of the Tips & Tricks for Sharing Financial Data session
Tip 1: Consider your audience before designing reports
Consider the needs and capabilities of your audience before designing reports, dashboards or visualizations for them. First, is the audience internal or external? Next, what expectations do they have about nonprofit financial information? For example, board members might expect a certain grouping and format of information. If you want to change a long-standing report package, walk your audience through the ‘why’ behind your new reporting and listen to their feedback.
Finally, consider how financially-minded your audience is and present the information with as much at-a-glance cognition as possible. By creating different role-based dashboards, you can tailor information to the needs of each audience — in the case of the example below, auditors or the board. The up and down arrows seen in the Board of Directors dashboard below are a good example of using at-a-glance cues to clarify for people that may not have a strong financial background.
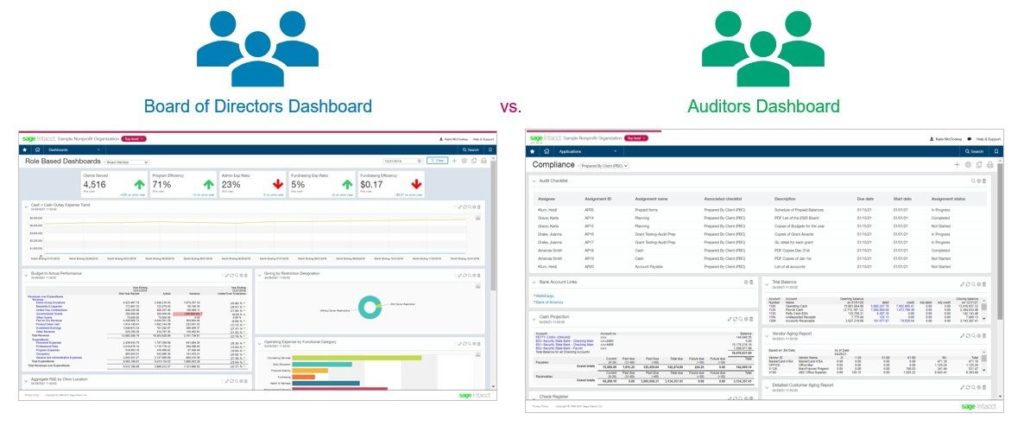
The dashboards above illustrate the disparate information needs of each of your audiences. Make sure to keep your audience in mind when sharing data.
Tip 2: Consider your delivery strategy
How will you deliver nonprofit financial information? Will you publish it out by sending a regular series of reports through email or storing them in a central location? Again, this will depend a bit on your audience. Some people need to receive reports because they won’t go looking for them on the network. Instead of receiving reports, would your audience prefer a self-service experience where they can get information whenever they want? Dashboards are a great vehicle for self-service information.
You can also use a combination approach. You would schedule automated reports to go out on a regular basis, but also make a self-service option available. Executives and board members could receive reports and, if they have additional questions, log in and drill down for more detailed information.
Tip 3: Choose an appropriate cadence of insight
How often will your team need to provide reporting? Is it needed on a routine basis, or is it a one-off exercise, such as reporting about a specific project? That will impact how you deliver the information and how often. Think about whether your audience needs access to real-time figures or if they would be better served by periodic data that has been blessed. For example, do you prefer to report on data only after it’s gone through the month- or quarter-end close?
Putting it all together
The example below comes from a Sage Foundation Annual Report and demonstrates the three tips we’ve discussed so far:
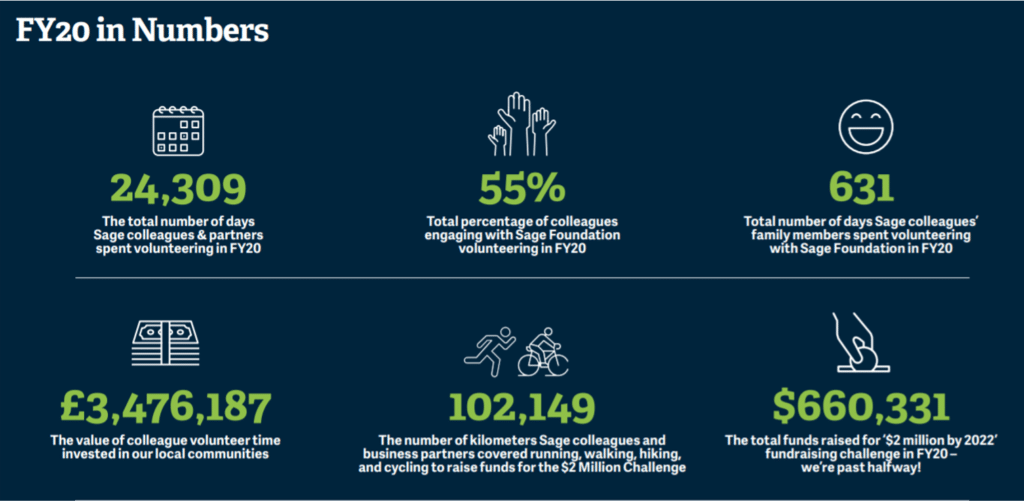
- Audience: In this case, the audience is not necessarily financially-minded. It would be any people who might be interested in becoming a donor or applying for a grant. Therefore, we present the information with lots of graphics to help share the story. The information shared is also very high level.
- Delivery strategy: By creating a graphic, this information can be easily and widely shared in a number of delivery formats. It appears in the annual report and can be posted online. It can also be shared on social platforms.
- Cadence: Because this information is in an annual report, the data covers an entire year’s results and the reports are created once each year. These figures would not be published in real-time and the reporting is done after year-end close.
Conclusion
These three tips only scratch the surface of the ten total reporting tips that Katie and MaryFrances shared during their session. They went on to describe seven additional ways to enhance your sharing of nonprofit financial information, including:
- Connecting impacts
- Actionable insight
- Supporting documentation
- Formatting for cognition
- Train or explain
- Context of benchmarks
- Trends, clusters, outliers & ‘what if’s’
Be sure to watch the entire presentation to get all the tips and tricks. We invite you to watch a replay of the full presentation — and five other virtual sessions by nonprofit finance and technology experts — at the virtual Nonprofit Finance Leaders Forum. For any questions, please contact Jim Norton, CPA, Senior Manager and head of Accounting Technology Services, at jnorton@grfcpa.com.